Andy Vetter, Brian Michitti
ECON 257K
A Statistical Analysis
Introduction
Nearly every
weeknight
The Data
The data
for
Data
gathered from various outside sources will be used to analyze all other
institutes. Mean grade point averages
and SAT scores were found from “The
Princeton Review” website and also the book “
Summary Statistics
The summary
statistics (see table 1) indicate that the mean state university GPA is 3.3025,
with a standard deviation f 0.2031. We
will be comparing this GPA of 3.3025 to the mean Hanover College GPA of 2.891. The mean SAT scores of incoming state
university students is 1081.92. The
standard deviation of these SAT scores are approximately 128 points. These mean
state university SAT score will also be compared to the mean
Table 1: Summary Statistics
|
|
State
GPA |
State
SAT |
State
Study |
Private
GPA |
Private
SAT |
Private
Study |
|
Mean |
3.3025 |
1081.9166 |
13.50333 |
3.225 |
1198.92 |
15.7107 |
|
Median |
3.355 |
1087 |
13.425 |
3.29 |
1204 |
15.72 |
|
Max |
3.52 |
1294 |
17.64 |
3.4 |
1319 |
19.45 |
|
Min |
2.9 |
921 |
10.21 |
2.82 |
1126 |
12.04 |
|
Std. Dev |
0.2031 |
128.0308 |
1.814363 |
0.1725 |
53.226 |
2.11052 |
|
Count |
12 |
12 |
12 |
13 |
13 |
13 |
When
looking at the private college statistics, we see that the mean GPA is 3.225,
with a standard deviation of 0.1725.
Incoming freshman to these private colleges had a mean SAT score of
1198.92. Standard deviation for the mean
SAT score was 53.2 points. The mean
number of hours study per week by students in private institutes is 15.71, with
a standard deviation of 2.11. These
statistics will also be analyzed with the mean
Do
One may
believe that we can answer this question by simply looking at the sample means (see
graph 1) of study hours and conclude that because
Graph 1: Mean Study Hours
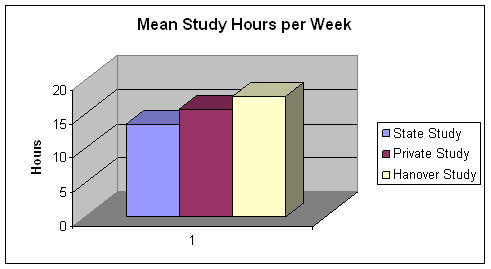
Because this is merely a sample, we do not know what the
actual mean study hours for either group actually is. Therefore, we must do some further analysis. Table 2 summarizes the difference in mean number
of hours studied per week by
Table 2: Study Hours by
Institute (Hanover, State)
|
|
|
State
Universities |
|
Sample
Mean |
17.54166667 |
13.50333333 |
|
Sample
Std. Deviation |
10.35041636 |
1.814363567 |
|
Sample
Size |
144 |
12 |
A
one-tailed hypothesis test would be required to determine whether the
difference between mean hours studied is significantly greater by
Ho: mh
- ms £ 0
Ha: mh - ms
> 0
At the 90% level of confidence, and 154 degrees of freedom,
the critical one tailed “t-value” is 1.2855.
Because the test statistic we found for the above data is 1.645, we can
reject our null hypothesis. Our test statistics of 1.645 is greater than our
critical value of 1.2855, allowing the figure to fall in the rejection range
for the null hypothesis. In other words,
we are 90% confident that there is a significant difference in the amount of
hours studied by
Do
We can once
again see that the mean number of hours studied per week by
Table 3: Study Hours by
Institute (Hanover, Private)
|
|
|
Private
Colleges |
|
Sample
Mean |
17.54166667 |
15.71076923 |
|
Sample
Std. Deviation |
10.35041636 |
2.110527033 |
|
Sample
Size |
144 |
13 |
Once again, because we have one sample size less than 30
(private n=13), we must use a t-distribution test. The test will be one-tailed because we wish
to see if
Ho: mh
- mp £ 0
Ha: mh - mp
> 0
At the 90% confidence level we are unable to reject the null
hypothesis. Our test statistic of .6325
is not greater than our critical value of 1.2855. Therefore we are unable to reject the null
hypothesis, and we are unable to conclude that there is a significant
difference between
Do
Now that we
have analyzed the amount of time the average student of each institute spends
studying, it is important for us now to examine how well the average student
tested on the SAT. This could be a
strong indicator for the actual learning ability of the average student entering
the different institutes. Table 4
summarizes the SAT scores for
Table 4: SAT of Incoming
Freshman (Hanover, State, Private)
|
|
|
State
Universities |
Private
Schools |
|
Sample
Mean |
1167.116667 |
1081.916667 |
1198.923077 |
|
Sample
Std. Deviation |
126.913865 |
128.0308616 |
53.22665613 |
|
Sample
Size |
120 |
12 |
13 |
Because we wish to find if there is any difference between the two sample means, we will be using a two-tailed test. Once again, we have samples of less than 30 (state n=12 and private n=30), we will be using a t-distribution test.
Ho: mh
- ms/p = 0
Ha: mh - ms/p
≠ 0
We find
that both tests will have approximately the same critical value of 1.645. This is the critical value for testing at a
90% confidence interval. When analyzing
Upon
comparison of
How does
The final necessary step in our study will be to compare the mean Hanover GPA to both other private college’s mean GPA and the mean state university GPA. The table below summarizes the data.
Table 5: GPA Summary
(Hanover, State, Private)
|
|
|
State
Universities |
Private
Colleges |
|
Sample
Mean |
2.891492754 |
3.3025 |
3.225384615 |
|
Sample
Std. Deviation |
0.515280892 |
0.203117745 |
0.172511612 |
|
Sample
Size |
138 |
12 |
13 |
The two research questions we would like to answer are “Is the
mean GPA for other private colleges/ state universities greater than
Ho: ms/p
- mh £ 0
Ha: ms/p - mh
> 0
A critical
value of -2.342 (99% confidence), with 148 degrees of freedom, will be used for
first analyzing the GPA of the mean state university GPA and the mean Hanover
GPA. We found our test statistic to be
-2.738, which falls within our rejection range for our null hypothesis. Therefore, with 99% confidence, we are able
to reject our null hypothesis. In other
words, we are 99% sure that the mean state university student’s GPA is
significantly greater than that of the average
Upon
comparison of
Significance of Findings
After running this series of hypothesis tests, we are able to make some valuable assumptions concerning our questions we originally hoped to be able to answer. When first looking at hours of time spent studying, we find that we are highly confident (90%) that the average student does indeed study more than the typical state university student. However we cannot conclude that there is a significant difference amongst study hours between Hanover and other private colleges. Although this may be something that could be guessed prior to even doing any research or running any tests, when we combine these findings with our other results, we do find some interesting outcomes.
We find no
significant difference between the incoming freshmen SAT scores of
As far as
state universities are concerned, we can conclude that the samples have a
significantly lower incoming freshman SAT score, lower average number of hours
studied per week, but still have a significantly higher mean GPA than that of
Hanover students. Again, we did not run
tests to figure out why this is the case, but we do feel that this makes
economic sense. Private institutes, such
as
Conclusion
The reason
for us initially deciding to look into the topic that we choose was because we
hoped to be able to eventually draw conclusions and form hypothesis similar to
what we have done about the relationship between Hanover and other
institutes. We found it very interesting
for us to actually be able to form some statistically supported answers to
questions the average
Looking at our findings from an economical perspective, we believe it all makes sense. It can be concluded that private school students must devote more time to their studies than state university students, only to see grades that are on average significantly lower. Because these private institutes generally cost more than large state universities, we should also expect the challenge to be greater. We believe it would probably be a disappointment to the person paying the tuition if this was not the case. The existence of this challenge is represented by the results of our data.
One hundred
and forty-five