
SALARY TASK FORCE PRESENTATION
FACULTY FORUM SUMMARY
2/17/2005
Barb Wahl gave an introduction and overview of the task force’s work to date. Please see the accompanying PowerPoint slides.
Eric Dodge showed a draft version of the “merit matrix” to be used to help determine merit pay increases beginning with contracts for 2005-06. The matrix is shown below.
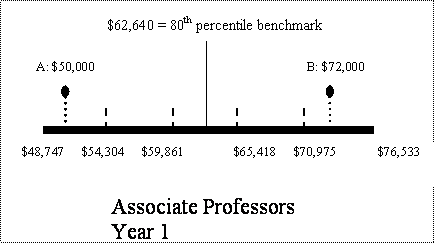
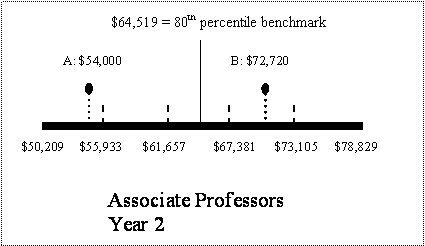
Eric also worked through an example of two Associate Professors. In Year 1, Prof. A’s salary was $50,000 (lowest quintile of the range) and Prof. B’s salary was $72,000 (highest quintile of the range). Prof A got an 8% raise because he/she had an outstanding review and his/her current salary was far below the midpoint. Prof. B got a 1% raise because he/she had a normal year and his/her salary was already way above the midpoint. So in year 2, A and B are both closer to the midpoint (the 80th percentile benchmark for that rank). A is still in the lowest quintile so next year he/she would tend to have another large raise. B fell into the 4th quintile in year 2, so he/she would tend to receive a larger % raise in the next year.
|
|
| Hanover College | |||||
| Proposed 2005 Merit Matrix | |||||
| Forecasted Percentages* Applied to Hanover Faculty Population Result in 4.5% Increase | |||||
Position of Employee Current Pay in Range |
|||||
Performance Level |
<20% position in range |
21% - 40% position in range |
41% - 60% position in range |
61% - 80% position in range | >80% position in range |
|---|---|---|---|---|---|
Far Exceeds Expectations (1) |
8% |
7% |
5.5% |
4.5% | 3% |
Exceeds Expectations (2) |
7% |
5.5% |
4.5% |
3% | 2% |
Meets |
6% |
4.5% |
3% |
2% | 1% |
Below |
1%** |
1%** |
0% |
0% | 0% |
Position in Range Distribution |
31.5% (29) |
45.7% (42) |
14.1% (13) |
6.5% (6) | 2.2% (2) |
*Please note that actual increases as a result of this matrix could be +/- 1% of the forecasted percentage shown
**Increases for employees in the "below expectations" category are for year one only; in future years employees falling in this category will not receive an increase. Note: All salaries will be rounded to nearest $100. |
|||||
Rob Graham reemphasized that among the salary grid’s purposes was an institutional desire to recognize good work while making the determination of salary recommendations more “transparent.” Annual salary recommendations will be a function of an individual’s position in the salary range and an evaluation of the individual’s work relative to expectations.
Rob noted that salary recommendations for 2005/2006 represent a transition phase. Multiple information sources including the individual’s annual report, self-evaluation and FEC letter (if the individual was recently reviewed by FEC), division head input, and input from the Vice President of Academic Affairs generated an evaluation of the individual’s work. That evaluation and the individual’s position in the salary range were applied to the salary grid to determine the salary recommendation for 2005/2006.
Division heads and the Vice President of Academic Affairs are interested in faculty input on how to make the salary grid work in the long term. Critical to making annual salary recommendations more transparent will be the work of David Cassel’s task force to develop a set of expectations based upon the Academic Vision Plan. In addition, Rob encouraged individuals to contact any salary task force member, division head, or the Vice President of Academic Affairs to provide input on the salary grid. Rob specifically asked faculty to provide input on two questions:
1) What information is needed in advance of salary recommendations to provide faculty guidance?
2) What information is necessary after salary recommendations have been determined to make the process more transparent?